Boeing: SpatialAnalyzer® & Reduced Vertical Separation Minimum
 Have you ever wondered just how close airplanes can fly next to each other in the air? November 2011 saw a worldwide implementation of Reduced Vertical Separation Minimum (RVSM), the reduction in vertical separation of aircraft between 29,000 ft – 41,000 ft from a 2,000-ft minimum to 1,000-ft minimum (+/- 200 ft). With the tolerance applied, aircraft could be separated vertically by only 600 ft within the RVSM Airspace. In order to safely and efficiently control high air traffic congestion, RVSM aims to stack aircraft in the most fuel efficient pattern while taking advantage of trade winds and optimum flight patterns. The RVSM allows aircraft to achieve greater fuel savings and safely increase airspace capacity by about 85%. Despite the decreased vertical separation between aircraft, the chance of a mid-air collision is 2.5 for every 100 million flight hours. So, what does this have to do with metrology and SpatialAnalyzer® (SA)?
 Boeing: SpatialAnalyzer® & Reduced Vertical Separation Minimum
Have you ever wondered just how close airplanes can fly next to each other in the air? November 2011 saw a worldwide implementation of Reduced Vertical Separation Minimum (RVSM), the reduction in vertical separation of aircraft between 29,000 ft – 41,000 ft from a 2,000-ft minimum to 1,000-ft minimum (+/- 200 ft). With the tolerance applied, aircraft could be separated vertically by only 600 ft within the RVSM Airspace.
In order to safely and efficiently control high air traffic congestion, RVSM aims to stack aircraft in the most fuel efficient pattern while taking advantage of trade winds and optimum flight patterns. The RVSM allows aircraft to achieve greater fuel savings and safely increase airspace capacity by about 85%. Despite the decreased vertical separation between aircraft, the chance of a mid-air collision is 2.5 for every 100 million flight hours. So, what does this have to do with metrology and SpatialAnalyzer® (SA)?
Measurement Requirements
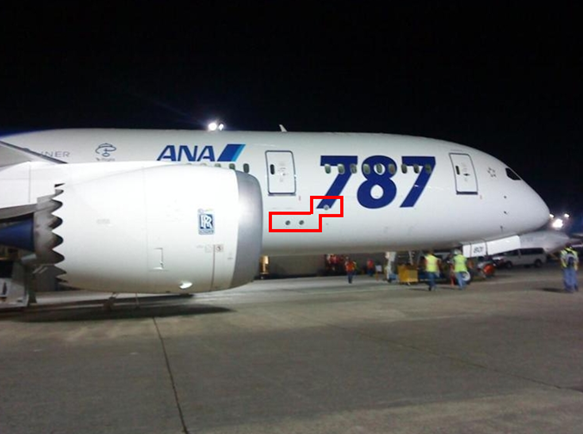
All commercial aircraft have pitot and static ports that detect the aircraft’s speed, altitude, and Mach number. Proper placement of the air data sensors and static ports require high-accuracy measurement. The more accurately the surface contour in these extra-critical regions is measured, the more precise the aircraft’s sensing capabilities. There are numerous challenges surrounding the RVSM measurement process:
- Measurement requirements are +/- 0.127 mm, so high-accuracy is essential.
- Non-contact measurement capability is required since static ports have a shiny surface and cannot be marked or dinged with a contact device.
- A large area must be measured—approximately three square meters on each side of the airplane.
- A high point density is required with a 6x6 mm grid.
- Measurements must be taken when the aircraft is on wheels.
- Measurement process must not interfere with the surrounding manufacturing processes.
- Measurements must be taken accurately despite movement and vibration of aircraft.
- Timely analysis and reporting methods to meet engineering requirements with the ability to generate any follow-on repairs or rework are required.
Measurement Process
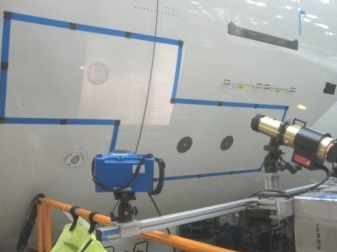
For hardware, two V-Stars Inca 3 Cameras and a Pro-Spot Projector with a 23K Slide mounted on a lifting device were selected. For software, SA was chosen to process, analyze, and report the results. The ability to analyze and report data quickly in an understandable manner was necessary. In fact, all 787 Final Assembly and Delivery data measurements and analysis are processed with SA.
After laying out targets and the surrounding outline, measurements are taken with a standard single, V-Stars camera to establish the common point network. Next, two cameras are used, synchronized in a multiple camera mode with the Pro-Spot Projector. The high density Pro-Spot slide projects up to 23,000 points onto the aircraft surface without applying any hard-targets. This process is repeated until the entire area is covered. To aid with target density, the projector slide can be rotated, applying targets in a different region. After the measurement sequence is completed, data is processed with SA.
Processing & Reporting in SA
The metrologists at Boeing use the Relationships feature in SA for the proper alignment of data. Reducing the data with SA allows surface-fitting of more than 100,000 points. The Output Reports capability in SA allows for report generation of individual static ports and overall surfaces. Report results indicate when a port is inconsistent and does not closely match the surrounding surface. Also, when incorrect shimming is detected, rework can be performed in order to meet requirements.
The automation analysis using SA’s scripted Measurement Plan allows for a very repeatable and accurate way to finalize the data. When thousands of data points are collected, outlier data inevitably occurs. Using a structured SA Measurement Plan, the task of removing the outlier data is accomplished along with the relationship fitting alignment. Prior to using the Measurement Plan option, data was manually aligned and cleaned. SA’s scripting capability has led to a significant time savings in this process.
Note: This article is based on a paper and presentation by Michael Lazar at CMSC 2012 in New Orleans, LA.
Sign up to receive our eNewsletter and other product updates by clicking here.