Point Clouds in SA: The Latest & Greatest
 The latest SA release included a significant amount of point cloud improvements and enhancements. Below is an overview of those changes and how they can come in handy on the job. Point Cloud Visualization, Cloud Display Control, Auxiliary Cloud Thinning Factor, and more are discussed in the article below.
Point Clouds in SA: The Latest & Greatest
The latest SA release included a significant amount of point cloud improvements and enhancements. Below is an overview of those changes and how they can come in handy on the job.
Point Cloud Visualization
One of the more challenging aspects of working with point cloud data is finding an optimal way to visualize the data. A cloud is often composed of millions of cloud points and it's important to find an ideal way to render them all graphically. SpatialAnalyzer has a number of visualization options to help you find the method that best suits your needs and job at hand.
Cloud Display Control
The number of cloud points displayed graphically can be controlled using the Cloud Display Control (View>Cloud Display Control Ctr+T). This utility provides the ability to adjust a global thinning factor, which reduces the overall number of cloud points displayed as well as cloud point size control.
As a point cloud is rotated or translated in the graphic view, the display resolution of the cloud will automatically reduce and be restored once the movement is stopped. Control over the extent of this additional thinning is also provided in the Cloud Display Control shown below.
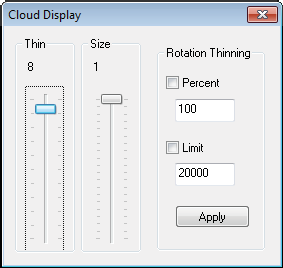
- Thin: the visual thinning factor applied. If set to eight for example, only one point in eight will be displayed.
- Size: the number of pixels used to display a point cloud point.
- Rotational Thinning: this section controls the additional thinning during graphical moves and rotations. Either or both of these rotation limits can be applied:
- Percent. If set, rotational thinning is controlled by a percentage value from 0-100 where 100 is no additional thinning.
- Limit. If set, rotational thinning is controlled by an upper limit of the number of cloud points displayed.
Auxiliary Cloud Thinning Factor
In addition to the global cloud thinning controls, each individual cloud can have its own thinning factor set independently through its properties. This allows clouds of very different densities to be equalized in their display.
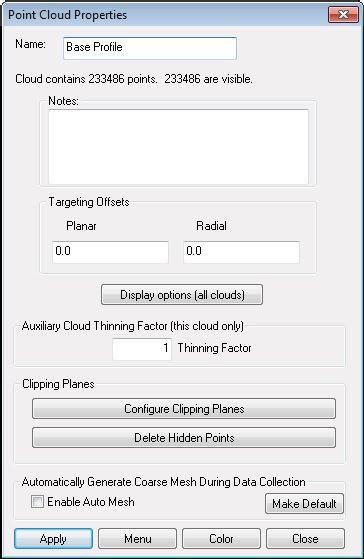
Clipping Planes
Clipping planes can be very useful in removing unwanted data from a scan. For example, when a part is set upon a flat surface and scanned, the splash measurements of the flat surface are included in the measurements of the part. Clipping planes provide an easy way to remove the measurements of the flat surface, leaving only the measurements of interest.
Clipping planes are defined through a point cloud’s properties and can be used in two ways:
- Defined in advance. If a clipping plane is defined for a cloud prior to scanning, the data obscured by the clipping plane will be automatically deleted.
- Defined after scanning. If a clipping plane is defined after the scan, then the hidden data is only hidden and not removed until the Delete Hidden Points command is used.
To define a clipping plane:
- Open the clouds properties dialog
- Press the Configure Clipping Planes button
- Press Add and select an object.
Each object in the Clipping Entities dialog (shown in image below) defines the base frame for a particular clipping volume. The XY plane of this object’s base frame defines the clipping plane by default, so if you choose a plane directly, it will be used as expected. However, you can choose any object as the reference object to define this plane.
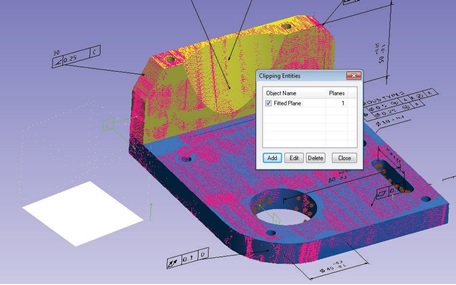
Each Clipping Entity defines a coordinate system, which defines not only a clipping plane but a full clipping cube or volume. Any of the six different clipping planes or sides of a cubic volume can be enabled and used as a clipping plane to fully enclose a specific region of data. Therefore, up to six clipping planes per object can be used and as many objects as you want can be added, all of which can refine the clipped volume. With multiple clipping entities defined, just about any specific volume can be partitioned to either eliminate or isolate cloud points from the cloud (as shown below).
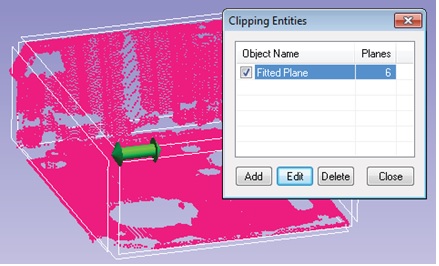
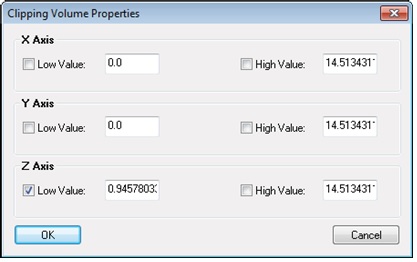
The clipping volume box can be controlled graphically. Simply place the mouse over an edge or corner and an arrow will appear, allowing you to drag that boundary to either increase or decrease its length. Particular clipping faces of this box can be turned on or off by hovering over them until the side illuminates and then clicking. For more explicit control, these controls can be accessed through the edit button as shown below.
These cloud specific clipping planes are distinct from the global clipping planes. These are available through the menu command View> View Control> Clipping Planes, which are for global visualization purposes only.
Scan Stripe Mesh Operations
Scan Stripe Meshes display a graphical rendering of cloud data in either of two formats:
- Real-Time Course Mesh is built as you scan and is a course, minimally processed mesh.
- Fine Mesh is either directly generated from an existing scan strip cloud or replaces a course mesh when the mesh is regenerated. It uses the specified meshing parameters to build a finalized mesh.
Real-Time Scanning Course Mesh
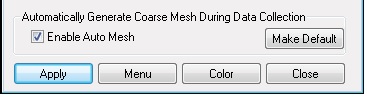
A course mesh can be enabled during scanning. This can be quite useful as an "easy to see" coverage indicator. In order to enable the Real-Time Scanning Course Mesh, go to the Scan Stripe Cloud properties menu and enable the option to Automatically Generate Course Mesh During Data Collection (as shown in the image below). This option is set to "off" by default, but can be enabled and set to default to "on." Doing so will cause all subsequent clouds built within that job file to also build course meshes as you scan. If this is done prior to scanning, it will build a placeholder Scan Stripe Mesh in the tree, which will update as you scan.
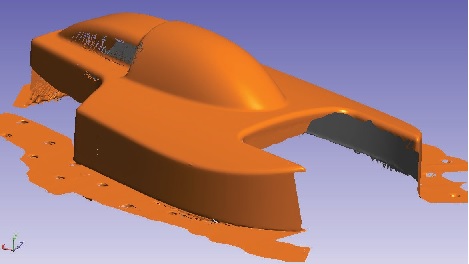
Fine Mesh Generation
A finalized mesh can be built from a Scan Stripe Cloud at any time. This can be done either from the right-click menu of the Cloud directly by choosing Generate / Regenerate Mesh, or through the menu command Construct>Polygonized Surface> From Point Clouds. When a Scan Stripe Cloud is chosen as the target, this same command will build a plygonized mesh from a standard cloud.
Feature Inspection Auto Filter
You can measure all of the features on the part independent of the GD&T analysis process, then associate the appropriate measurements with the corresponding Datums and Feature Checks afterwards.
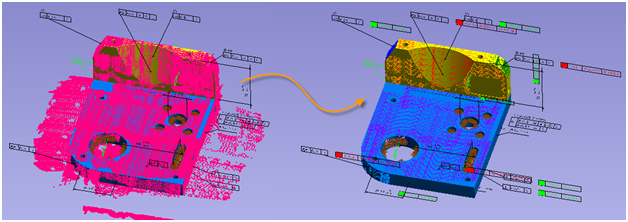
Once you've measured your part, go to the GD&T menu and select Feature Inspection Auto Filter. This filter goes through all measurements in the job within a specified distance from the part (whether they are individual points, point groups, or point clouds), filters them into individual groups associated with the particular CAD face, and assigns them to the appropriate feature check or datum in one operation. Of course, this method requires CAD surfaces and an initial alignment to get the points close to the appropriate surfaces. Afterwards, the Evaluate all Feature Checks option will complete the GD&T analysis.
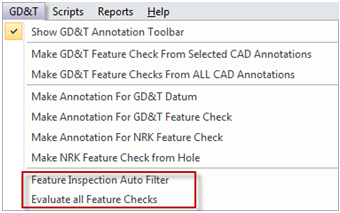
This is a particularly useful approach to GD&T when using a scanner. If you initially locate a scanner and then fully scan the part you are evaluating, you are just two clicks away from a completed GD&T analysis.
Questions? Contact NRK Support at support@kinematics.com.
Sign up to receive our eNewsletter and other product updates by clicking here.