Improving Instrument Performance by Reducing Composite Uncertainty
 We often find that new SA users have questions concerning the distinction between a modern laser tracker and a tracking total station. Is one instrument’s accuracy significantly different from the other’s, or would the two be comparable for similar range conditions (<75m)? With SpatialAnalyzer (SA), we can utilize uncertainty analysis tools to explore this question. What is Measurement Uncertainty? Read on to find out.
Improving Instrument Performance by Reducing Composite Uncertainty
We often find that new SA users have questions concerning the distinction between a modern laser tracker and a tracking total station. Is one instrument’s accuracy significantly different from the other’s, or would the two be comparable for similar range conditions (<75m)? With SpatialAnalyzer (SA), we can utilize uncertainty analysis tools to explore this question.
What is Measurement Uncertainty?
Put simply, measurement uncertainty is a statement of how sure you are that the true position of a point is where you say it is.
It is important to realize that an uncertainty calculation is always going to be an estimation. Instrument manufacturers put a great deal of effort into isolating and quantifying the accuracies of their measurement systems and reporting an accuracy specification with their product. In real measurement applications however, many factors can influence uncertainty:
• Instrument uncertainty and accuracy at a given distance
• Added targeting or tooling uncertainty
• Environmental influences such as wind, vibration, etc.
• Operator influences, particularly with instruments that rely on sighting
• Geometry contributions
• Fixturing influences
• Scale or temperature uncertainty
• Networking instruments builds interrelated measurement systems whose combined characteristics are dramatically different from the individual source measurements.
In addition, measurement uncertainty statements typically report a spherical uncertainty and do not address the more complex geometric nature of a measurement in determining its accuracy. Surprisingly, the simplification of reporting a +/- value may lead you to overestimate the true uncertainty if you were to look at the position in three-dimensional space.
SA takes advantage of the instrument’s observation accuracy statements. It provides a clearly defined set of variables for the measured attributes (e.g., range, horizontal, and vertical angles). It models the uncertainty for each measured attribute relative to the range between each target and the instrument. It uses those models to compute uncertainty estimates and then helps you visualize those uncertainties in 3D. Once computed, the uncertainty analysis tools evaluate the influence of instrument position and point distribution based upon these defined variables. SA provides a suite of tools that enables metrologists, engineers, customers, and even managers to objectively evaluate and understand the relative uncertainties for the measurement setup. It also helps to communicate those results effectively to colleagues and customers.
Measurement Uncertainty and Visualization in SA
The best way to determine the uncertainty of the measurements from your instrument in your environment is to measure a point multiple times under those exact conditions. For example, if you simply measured a point 100 times, you would end up with a group of points all with slight deviations from one another. There would be a greater number of points near the center of the group and fewer as you looked outward to the few outliers along the periphery. This variation is known as a Gaussian distribution.
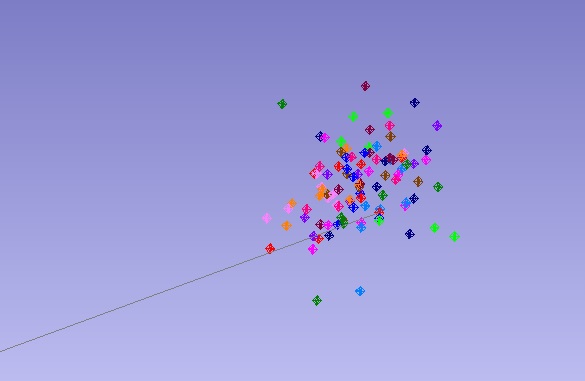
SA takes this fundamental principle and expands upon it by providing the ability to compute and report measurement uncertainty estimates. It provides a numerical list of each point’s computed uncertainty estimates, but also presents uncertainty data visually as a point cloud (around the measurement). The point cloud represents the geometric region where the target’s true position actually lies. This point cloud is referred to as a sensitivity cloud in SA. These sensitivity clouds can be expanded for different level of confidences. The default level of confidence is 68%, but that can be easily changed to 95.4% or 2-sigma. There are a wide range of confidence interval reporting options.
Total Station vs Tracker Accuracies and Uncertainty
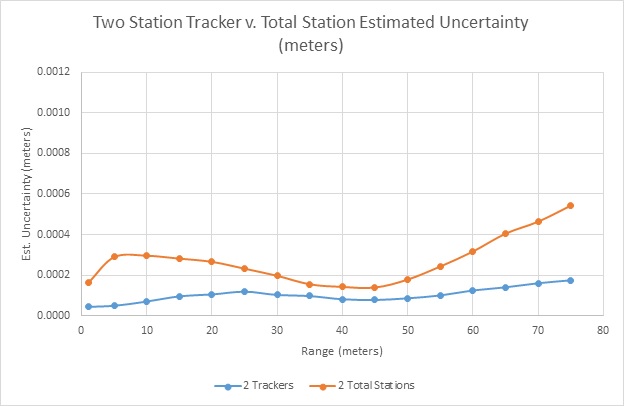
To explore the questions of tracker versus total station accuracies, let’s start with a simple one-station instrument uncertainty comparison by shooting targets from one to 75 meters away. The estimated uncertainty for points shot from a single tracker and then single total station at these ranges is shown below. Note that the tracker and total station are placed at one end of the field.
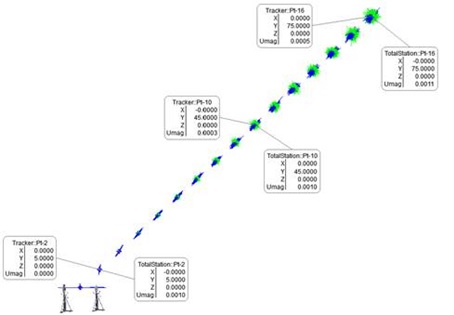
We used the function Analysis >> Coordinate Uncertainty >> Create Uncertainty Fields for each target. Those are shown graphically and numerically in the figure above and again in a graph below. The units are meters, in inches 0.001 m = 0.039 inches. The total station’s uncertainty doesn’t change significantly over this range; however, the laser tracker’s uncertainty is much smaller up close and climbs to 0.0005 m (0.020 inches). These uncertainties are reported at a level of confidence of 68%.
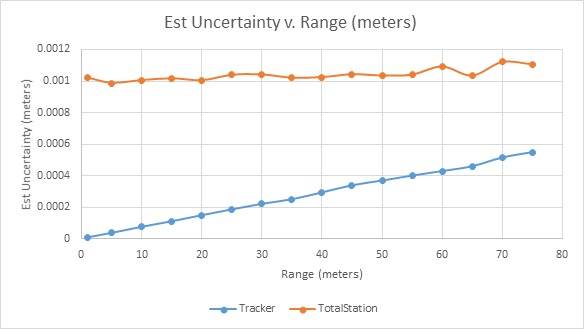
These charts show a significant difference between the tracker and total station when only one station is used. However, the uncertainty can change significantly when the points are measured from multiple stations. The SA screenshot and graph below show an example of the estimated uncertainty when USMN optimizes the point network by weighting the observations based on their estimated uncertainty. Note that point uncertainties improved for both types of stations.
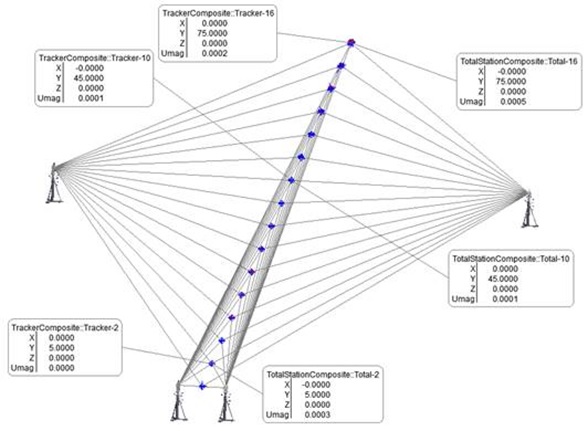
The chart below shows the same points shown in the prior chart. Note that the vertical axis scale was set to the same range to make it easier to compare the relative uncertainty differences.
At 45 meters, the one station tracker uncertainty improved from 0.34 mm to 0.08 mm (0.013” to 0.003” respectively) when the second tracker was set up 10 meters from the 45-meter target. The 45-meter target’s single total station uncertainty was 1.04 mm versus 0.14 mm (0.041” to 0.005” respectfully) when a second station at 10 meters from the target also shot the target. However, as the geometry to the target changes, the total station uncertainty varies more than the estimate uncertainty from the trackers.
Further advantages can be gained by adding an additional station, but we don’t expect the improvements to be as significant. In general, laser trackers deliver measurements with lower certainty for these types of applications. The total station is able to produce measurements with uncertainties that are much better than the single station specification, particularly if the stations are set up to use the precision angle measurements.
This simple example explains how SA can help users maximize the use of their instruments, objectively compute the expected uncertainty of their measurements, and easily communicate these results to others.
Questions? Do you have any hints or tips of your own that you’d like to share? Contact NRK at support@kinematics.com.
Sign up to receive our eNewsletter and other product updates by clicking here.