Reporting Options in SA -- Managing Callouts for Inspection
 A number of significant improvements have been made in recent SA releases regarding callouts and dynamic reports. These changes have provided a toolset that, when used effectively can add a significant level of automated operator guidance as well as clarity to reporting. Read on to learn the “ins and outs” of managing callouts. Read on to learn more and how you can use this on the job.
Reporting Options in SA -- Managing Callouts for Inspection
A number of significant improvements have been made in recent SA releases regarding callouts and dynamic reports. These changes have provided a toolset that, when used effectively can add a significant level of automated operator guidance as well as clarity to reporting. Read on to learn the “ins and outs” of managing callouts.
Callout Fundamentals
To start, it is important to understand the terminology of callouts. When we talk about a callout, it can potentially mean two separate things: a callout view or an individual graphical label. The reason for this distinction is that a typical “callout” actually consists of both a saved view (Callout View), which is an entry in the SA tree bar and the assortment of individual graphical elements (Callouts) within it. As shown below in the SA Toolkit on the Reporting Tab (Figure 1A), it is easiest to refer to Callout Views and use the simple callout term as being any one piece of that view. As you can see in Figure 1, the properties of a Callout View are simply for recalling and saving a view.
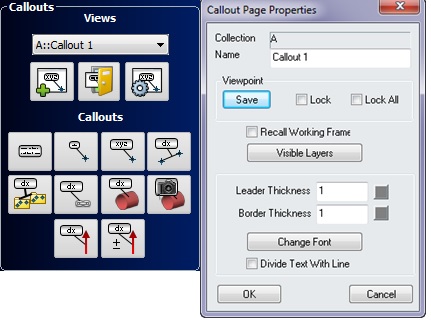
Figure 1. Toolkit Callout controls (A) and Callout View Properties (B).
A Callout View is in fact just that; a saved perspective (graphical orientation and depth) in your job file. When you “activate” a callout, you automatically set the graphic display to this saved perspective. This perspective on the job can be used to recall a specific working frame and a saved list of visible objects, displaying only the items you wish to display from the perspective you wish to view them (Figure 1B). The ability to tie visibility layers to callouts is one of the most powerful ways callouts can be used, mainly because irrelevant features can be hidden. A limitless number of 2D callouts can then be added to the View to display critical information both graphically and numerically.
Adding and Customizing Callouts within a Callout View
A selection of callouts can be added to a view. These callouts can be added to points, objects, or relationships as needed. The extent of customization of these controls has been expanding with each recent SA release.
Min/Max Magnitude Vector Callout - A new callout construction tool has been added to build a set of vector callouts showing a user selectable number of the largest and smallest vectors from that group. The look and usability of vector callouts have also been improved. Vector Callouts can now have the vector name colorized to match the vector color, helping to identify which vector is being referenced. Also, tolerances can be shown numerically in the callout and the distance out of tolerance shown in either of two color schemes.
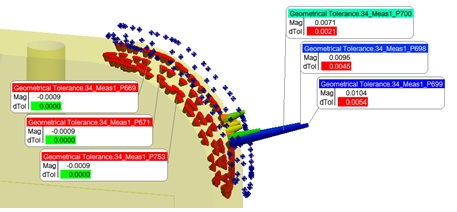
Image Callout - This new callout type allows you to add an image as an overlay directly within the SA graphics. This can be very useful in prompting operators with visual aids during a measurement process. A perfect example of how this can be helpful is shown in Figure 2.
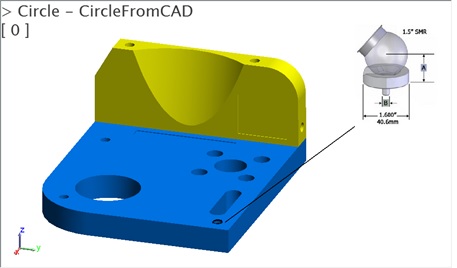
Figure 3. Image Callout helping to notify an operator that a particular tooling requirement is needed for a feature.
While it is already possible to automate a particular measurement profile or tooling within the interface of the instrument using trapping controls in the SA Toolkit, this type of visual display can make a big difference for an operator attempting to follow a measurement process. Callouts can be activated manually from the tree by double clicking on them or by automating the process.
Callout Automation and Operator Guidance
Callout Views can be directly linked to relationships for use in inspection via the SA Toolkit. This can be done by either adding a relationship to an existing Callout View or directly creating an inspection callout for that particular relationship. To do so, try one of the following:
- Right-click on the relationship in either the tree or the inspection task list and choose Create Associated Inspection Callout. This will build a new Callout View with the particular relationships callout added to it. Edit the properties of the new Callout as desired.
- Go to an existing callout and use Add Relationship. Each relationship added to a Callout View will then be linked to it. This allows multiple relationships to use a common Callout View, which will be set as active when trapping starts for any of the linked relationships.
Using inspection callouts can be very effective when measuring a part using fit and compare relationships. With a Callout View linked to a GR-relationship, the associated callout view is activated and the callout statistics are shown tied to the nominal part as soon as you start trapping. This guides the operator to that specific point to begin measurement. As soon as a valid fit is achieved, the callout leader line moves to the measured feature and the statistics update in a live display on the screen.
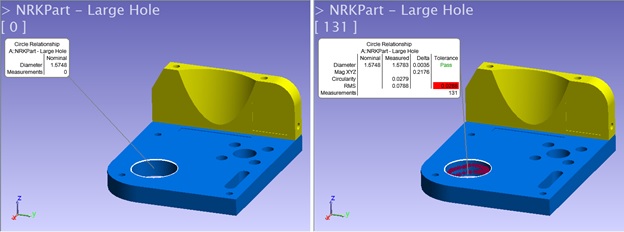
Figure 4.Geometry relationships adapt as you measure them from identifying a nominal to displaying measured statistics.
A wide selection of specific criteria can be displayed for a feature (either SA object or GR-Relationship) and the callout can be customized to display any or all components of interest in the graphics. This graphic display can also be separated from what is included in a report, which allows a user to display a select list in the graphics but report in great detail.
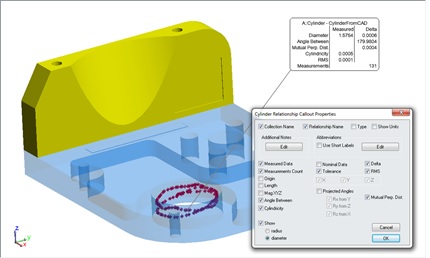
Figure 5. Controls allow full customization of callouts within a View.
Dynamically Updated Callouts within Reports
Callout images can now be updated within SA reports easily and automatically. The refresh button at the top of all dynamic reports has been enhanced to refresh all the callout view images in the report. You can also set callout images to refresh automatically when you open a report, or disable this refresh function through the report settings page if needed. These optional controls have been added to the Report Settings Dialog.
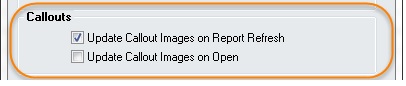
Figure 6. Callout Refresh Controls in Report Page Settings
One challenge in updating callout images is that when the size of the graphics window changes, so do the callout image proportions, and the layout of the image. For example, if you were to drag the report bar upward to see more of the report bar, you are in turn reducing the height of the graphic window while its width remains the same. Callout images can now be added to a report and refreshed without fear of changing the proportions of those images (the proportions of the callout are saved when they are added to the report and so the ratio is maintained). This makes it easier to place labels exactly where desired and refresh reports without losing your formatting.
If for some reason you want to change both the layout and proportions of the image in the report, you can go make your changes within the callout view and then use the Save View button to update the saved perspective. Once the report refreshes, this new image will be used while maintaining the same location within the report.
A powerful part of SA’s dynamic reports is the fact that reports can be built before a measurement process is performed, adapted as a template from an initial measurement, and/or as the measurements are obtained the report updates with them. Callouts are now able to do the same thing and thus keep pace with your high speed workflow.
Questions? Do you have any hints or tips of your own that you’d like to share? Contact NRK at support@kinematics.com.
Sign up to receive our eNewsletter and other product updates by clicking here.